HEIGHT DT/DZ TDIFF CRITICAL INVERSION
403. 0.011 2.1 ****
626. 0.012 2.6 ****
853. 0.014 3.2 ****
1089. 0.015 3.6 ****
1583. 0.013 6.6 ****
2106. 0.005 2.8 ****
2654. 0.001 0.4
3230. 0.001 0.4
3836. 0.000 0.1
4477. 0.001 0.5
5160. 0.004 2.8
5896. 0.003 2.4
6691. 0.002 1.3
7553. 0.001 0.5
8502. 0.004 4.1
9569. 0.003 3.6
10785. 0.004 4.9
12221. 0.008 11.5 ****
14040. 0.014 25.4 ****
16538. 0.012 30.6 ****
20783. 0.025 **** ****
26667. 0.031 **** ****
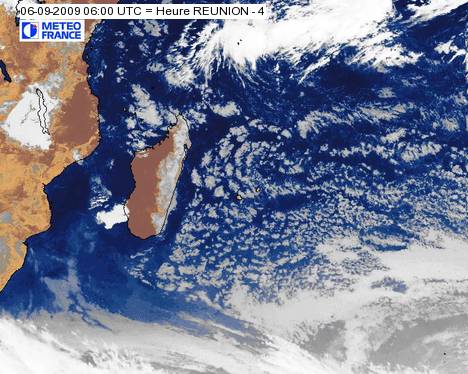
gdas1.sep09.w1
Lat/Lon/Elev: -29.97 30.95 8m
E = Estimated Surface Height
|
HEIGHT   DT/DZ TDIFF CRITICAL INVERSION
  374.   0.019   3.1      ****
  603.   0.011   2.4      ****
  840.   0.006   1.5
 1082.   0.002   0.6
 1585.   0.000   0.1
 2107.   0.001   0.3
 2655.   0.001   0.7
 3230.   0.001   0.5
 3836.   0.000   0.1
 4477.   0.002   1.0
 5162.   0.006   4.2      ****
 5902.   0.002   1.6
 6700.   0.002   1.7
 7569.   0.003   2.9
 8530.   0.004   4.0
 9608.   0.003   3.3
10837.   0.004   4.7
12282.   0.005   7.3      ****
14075.   0.011  19.2      ****
16539.   0.013  32.6      ****
20780.   0.026  ****      ****
26668.   0.033  ****      ****

 gdas1.sep09.w1
        Lat/Lon/Elev: -29.97   30.95       8m
E = Estimated Surface Height
|
 HEIGHT   DT/DZ TDIFF CRITICAL INVERSION
  426.   0.001   0.1
  648.   0.002   0.4
  875.   0.005   1.1
 1107.   0.009   2.1      ****
 1592.   0.009   4.4      ****
 2101.   0.005   2.4
 2638.   0.006   3.2      ****
 3206.   0.003   1.7
 3807.   0.004   2.3
 4449.   0.006   3.8      ****
 5138.   0.005   3.4
 5878.   0.002   1.4
 6677.   0.002   1.7
 7548.   0.002   2.1
 8505.   0.002   1.9
 9578.   0.005   5.1
10812.   0.006   7.6      ****
12279.   0.009  13.0      ****
14116.   0.008  15.4      ****
16579.   0.012  29.0      ****
20789.   0.024  ****      ****
26628.   0.033  ****      ****

 gdas1.sep09.w1
        Lat/Lon: -27.43   45.25
E = Estimated Surface Height
|
HEIGHT   DT/DZ TDIFF CRITICAL INVERSION
  433.   0.001   0.2
  656.   0.002   0.5
  882.   0.004   0.8
 1115.   0.007   1.7
 1597.   0.007   3.4      ****
 2106.   0.008   3.9      ****
 2643.   0.007   3.8      ****
 3213.   0.005   2.7
 3817.   0.004   2.2
 4458.   0.002   1.6
 5146.   0.005   3.7      ****
 5887.   0.003   2.4
 6687.   0.002   1.7
 7558.   0.002   1.7
 8515.   0.002   1.7
 9588.   0.005   5.8      ****
10827.   0.006   8.0      ****
12300.   0.009  13.9      ****
14128.   0.006  11.0      ****
16591.   0.013  31.2      ****
20794.   0.025  ****      ****
26668.   0.034  ****      ****

 gdas1.sep09.w1
        Lat/Lon: -27.43   45.25
E = Estimated Surface Height
|
HEIGHT   DT/DZ TDIFF CRITICAL INVERSION
  439.   0.000   0.1
  661.   0.001   0.2
  888.   0.003   0.6
 1120.   0.005   1.1
 1600.   0.005   2.4      ****
 2103.   0.002   1.3
 2633.   0.013   6.9      ****
 3202.   0.008   4.7      ****
 3808.   0.005   3.2      ****
 4454.   0.005   3.2      ****
 5147.   0.005   3.3
 5893.   0.003   2.1
 6699.   0.002   1.9
 7578.   0.003   2.9
 8548.   0.002   2.1
 9629.   0.003   2.8
10874.   0.010  12.4      ****
12359.   0.005   7.1
14172.   0.005   9.7      ****
16616.   0.012  29.8      ****
20751.   0.025  ****      ****
26574.   0.032  ****      ****

 gdas1.sep09.w1
        Lat/Lon: -22.82   54.51
E = Estimated Surface Height
|
 HEIGHT   DT/DZ TDIFF CRITICAL INVERSION
  448.   0.001   0.2
  671.   0.001   0.3
  898.   0.003   0.6
 1130.   0.004   1.0
 1610.   0.005   2.6      ****
 2114.   0.004   2.1
 2646.   0.006   3.0      ****
 3213.   0.012   6.8      ****
 3818.   0.007   4.1      ****
 4464.   0.004   2.6
 5156.   0.005   3.3
 5902.   0.003   2.1
 6706.   0.002   1.6
 7585.   0.004   3.2
 8553.   0.002   2.0
 9634.   0.004   4.1
10883.   0.010  12.2      ****
12370.   0.004   6.5
14185.   0.005   9.1      ****
16620.   0.013  31.7      ****
20761.   0.024  98.4      ****
26586.   0.034  ****      ****

 gdas1.sep09.w1
        Lat/Lon: -22.82   54.51
E = Estimated Surface Height
|
![[]](http://m3.moostik.net/img/?pseudo=vega)