HEIGHT DT/DZ TDIFF CRITICAL INVERSION
401. 0.000 0.1
622. 0.002 0.5
847. 0.003 0.7
1077. 0.004 1.0
1555. 0.005 2.4
2059. 0.012 5.9 ****
2597. 0.008 4.5 ****
3165. 0.003 1.9
3768. 0.005 3.2 ****
4410. 0.004 2.8
5097. 0.005 3.4 ****
5838. 0.003 2.4
6639. 0.004 3.3
7519. 0.006 4.9 ****
8493. 0.003 3.2
9580. 0.001 1.6
10816. 0.004 4.4
12262. 0.003 4.0
14054. 0.012 20.9 ****
16509. 0.012 30.3 ****
20618. 0.022 91.6 ****
26306. 0.033 **** ****
gdas1.oct09.w3
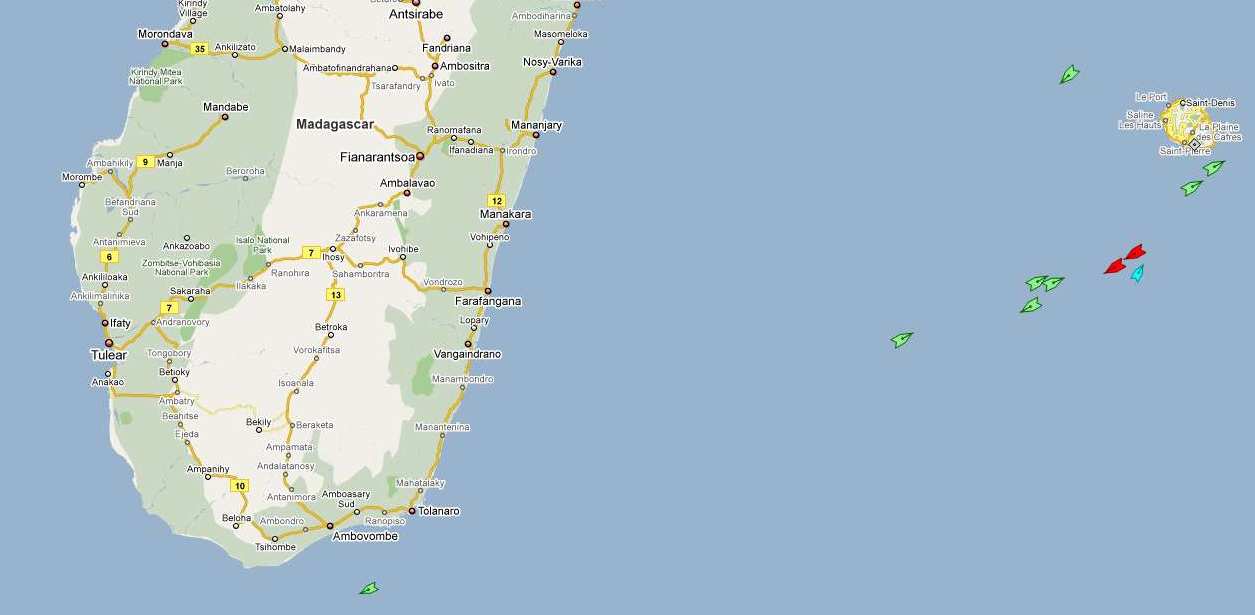
Lat/Lon/Elev: -29.97 30.95 8m
E = Estimated Surface Height
|
HEIGHT   DT/DZ TDIFF CRITICAL INVERSION
  384.   -.001  -0.2
  604.   0.002   0.4
  829.   0.002   0.4
 1059.   0.005   1.0
 1536.   0.007   3.2      ****
 2040.   0.009   4.6      ****
 2576.   0.009   5.0      ****
 3145.   0.005   3.0      ****
 3747.   0.004   2.6
 4389.   0.005   3.0
 5077.   0.004   3.0
 5816.   0.003   2.1
 6616.   0.003   2.4
 7490.   0.004   3.9
 8460.   0.005   4.7
 9548.   0.003   3.6
10786.   0.003   3.4
12234.   0.004   6.1
14038.   0.012  20.9      ****
16515.   0.012  30.9      ****
20641.   0.022  91.3      ****
26348.   0.032  ****      ****


 gdas1.sep09.w1
        Lat/Lon/Elev: -29.97   30.95       8m
E = Estimated Surface Height
|
HEIGHT   DT/DZ TDIFF CRITICAL INVERSION
  363.   0.005   1.1
  587.   0.009   2.0
  816.   0.009   2.2      ****
 1052.   0.009   2.2      ****
 1542.   0.010   4.7      ****
 2060.   0.007   3.8      ****
 2608.   0.006   3.3      ****
 3187.   0.002   1.1
 3799.   0.003   1.9
 4450.   0.003   1.9
 5145.   0.004   3.0
 5894.   0.004   3.1
 6703.   0.002   1.6
 7585.   0.002   1.9
 8554.   0.002   1.6
 9633.   0.002   1.8
10862.   0.005   6.1
12317.   0.007   9.7      ****
14123.   0.010  18.3      ****
16588.   0.010  24.8      ****
20736.   0.025  ****      ****
26513.   0.031  ****      ****

 gdas1.sep09.w3
        Lat/Lon: -27.43   45.25
E = Estimated Surface Height
|
HEIGHT   DT/DZ TDIFF CRITICAL INVERSION
  354.   0.004   0.9
  577.   0.008   1.8
  807.   0.009   2.1      ****
 1042.   0.009   2.2      ****
 1532.   0.009   4.4      ****
 2049.   0.008   4.3      ****
 2597.   0.006   3.1      ****
 3177.   0.003   1.7
 3790.   0.003   2.0
 4442.   0.004   2.7
 5140.   0.003   2.2
 5889.   0.004   2.9
 6701.   0.003   2.1
 7584.   0.002   1.5
 8555.   0.002   1.7
 9637.   0.002   2.6
10869.   0.004   4.5
12321.   0.007   9.5      ****
14131.   0.010  18.1      ****
16590.   0.010  24.4      ****
20730.   0.026  ****      ****
26525.   0.031  ****      ****


 gdas1.sep09.w1
        Lat/Lon: -27.43   45.25
E = Estimated Surface Height
|
HEIGHT   DT/DZ TDIFF CRITICAL INVERSION
  402.   0.000   0.1
  625.   0.001   0.3
  852.   0.007   1.5
 1084.   0.004   1.0
 1565.   0.004   1.8
 2070.   0.005   2.4
 2604.   0.010   5.6      ****
 3177.   0.013   7.4      ****
 3788.   0.003   2.1
 4438.   0.004   2.3
 5134.   0.005   3.5
 5884.   0.003   2.5
 6698.   0.004   3.5
 7586.   0.002   1.8
 8560.   0.001   1.0
 9648.   0.003   3.3
10885.   0.003   4.0
12348.   0.008  12.1      ****
14159.   0.006  11.3      ****
16589.   0.011  27.3      ****
20731.   0.025  ****      ****
26475.   0.032  ****      ****

 gdas1.sep09.w3
        Lat/Lon: -22.82   54.51
E = Estimated Surface Height
|
HEIGHT   DT/DZ TDIFF CRITICAL INVERSION
  395.   0.000   0.1
  618.   0.002   0.5
  846.   0.004   1.0
 1079.   0.004   0.9
 1562.   0.005   2.2
 2068.   0.005   2.7      ****
 2604.   0.010   5.3      ****
 3177.   0.011   6.5      ****
 3789.   0.005   3.0
 4440.   0.004   2.4
 5138.   0.005   3.7      ****
 5891.   0.004   3.1
 6706.   0.003   2.3
 7593.   0.001   1.3
 8568.   0.001   1.5
 9655.   0.003   2.9
10892.   0.003   4.3
12353.   0.007  10.1      ****
14164.   0.007  13.3      ****
16598.   0.012  28.5      ****
20728.   0.024  ****      ****
26497.   0.032  ****      ****

 gdas1.sep09.w3
        Lat/Lon: -22.82   54.51
E = Estimated Surface Height
|
![[]](http://m3.moostik.net/img/?pseudo=vega)