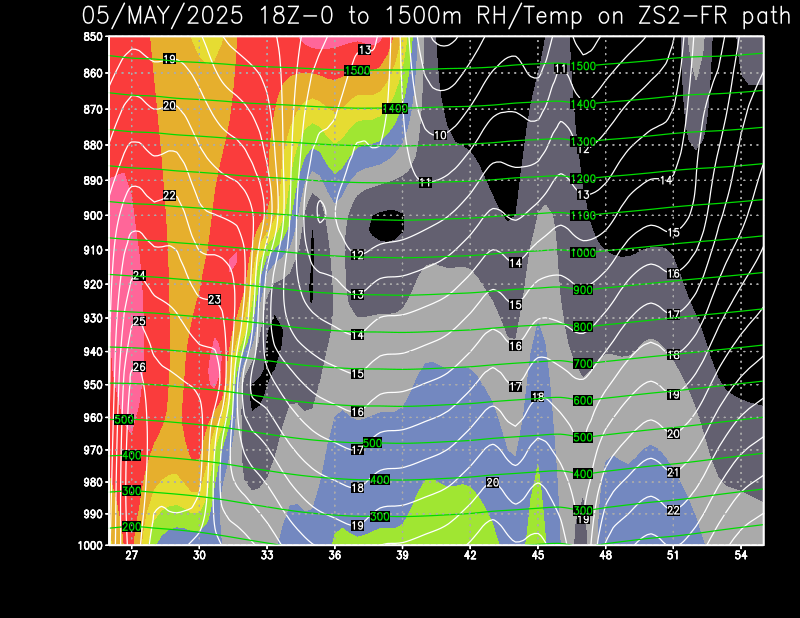
Troposphere vertical view on
ZS2 to FR paths - just a very relative approach...
Grid Analysis and
Display System (GrADS) is used to build
images. Remember, tropo
happens if above a given height , RH decreases and T°
higher
than standard , giving dry/warm area in altitude.
Humidity
color scale used in images (%) (rose
- red colors are equivalent to very good
tropo, with RH
decrease, T° increase, and if not similar scale with lower
height air
mass)


![[]](http://m3.moostik.net/img/?pseudo=vega)